> ## Documentation Index
> Fetch the complete documentation index at: https://docs.vms.verolabs.co/llms.txt
> Use this file to discover all available pages before exploring further.
# Setup your first probe
> Step-by-step guide on how to configure and manage monitoring probes on VMS Agent
## Probe Configuration Overview
Once you have successfully installed the VMS Agent Collector, you can start configuring Probes to monitor host resources, network ports, containers, logs, or service endpoints.
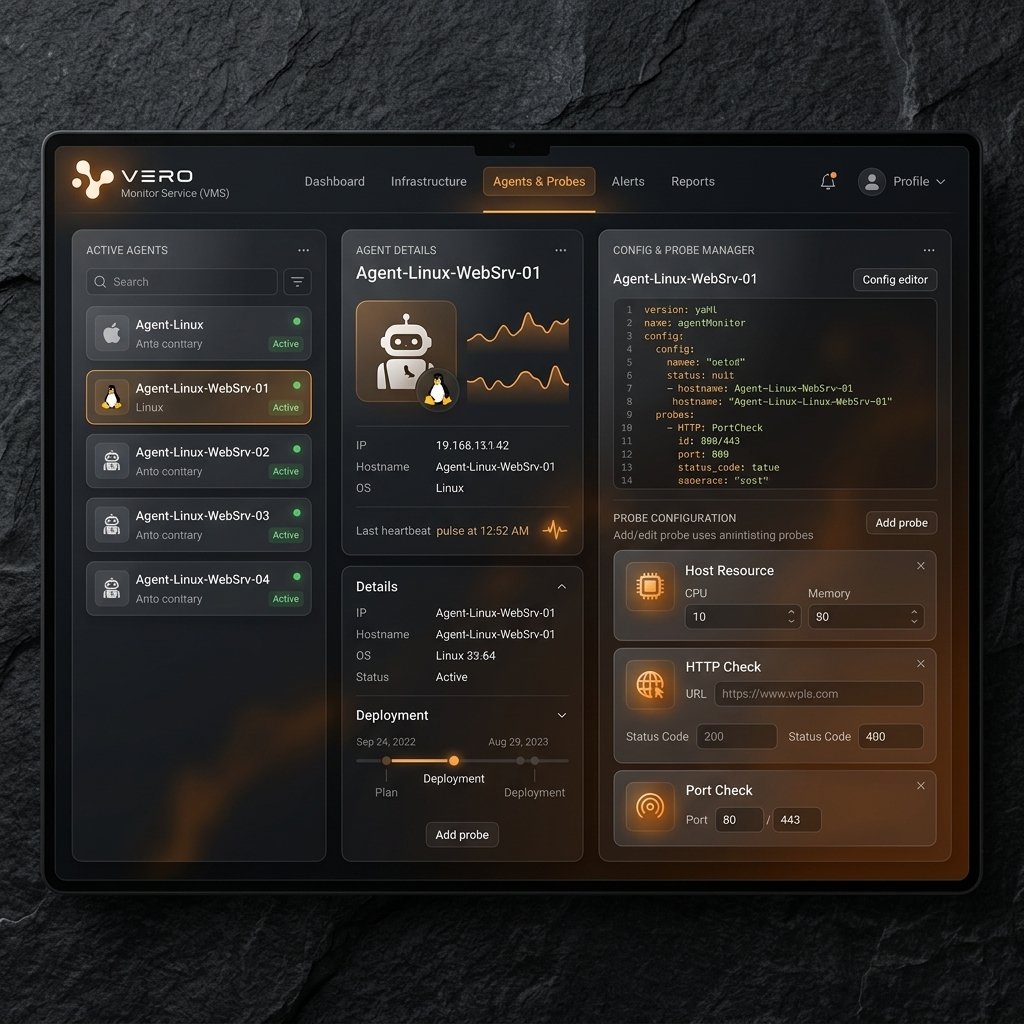
The VMS Dashboard interface allows you to view the list of active agents, monitor their health status, and manage their corresponding probe configurations:
 ## Steps to Configure a New Probe
You add or update monitoring probes through the VMS Dashboard; the configuration is synced down to the Agent.
Determine what host, service, or endpoint needs monitoring. For example, to check the HTTP endpoint of a web service at `https://api.verolabs.co/health`.
Choose the appropriate probe type based on your target:
* Use `host_resource` for monitoring CPU, RAM, or Disk.
* Use `http_check` for monitoring HTTP/HTTPS endpoints.
* Use `check_port` for checking TCP port reachability (e.g. SSH port 22, database ports).
Configure the probe with basic attributes like identifier `code`, display `name`, run `intervalSeconds`, and the specific probe `config` block.
Example configuration for an HTTP Check probe:
```json theme={null}
{
"code": "api-health-check",
"name": "HTTP check API Vero",
"type": "http_check",
"intervalSeconds": 60,
"timeoutMs": 5000,
"enabled": true,
"config": {
"url": "https://api.verolabs.co/health",
"method": "GET",
"expectedStatus": [200]
}
}
```
* On the VMS Dashboard, click **Save / Apply** to deploy the configuration to the Agent.
* The Agent automatically pulls the new configuration on its sync cycle (`VMS_CONFIG_REFRESH_SECONDS`, usually 30–60s) without a service restart.
## How to Verify if a Probe is Successful or Failing
### 1. Check Status on VMS Dashboard
* **Success State (Green):** The probe returns a valid response, and all assertions (if any) pass. The dashboard indicates this with a `Green` status dot.
* **Failed State (Red):** The probe fails to connect or assertion fails (e.g. HTTP status 500 instead of 200). The dashboard status changes to `Red` or `Critical`, and alerts are sent out to the configured channels.
### 2. Check logs on the Host
You can view the VMS Agent service logs to verify that configuration updates are received and probes are executing successfully:
```bash theme={null}
# View real-time logs of VMS Agent
journalctl --user -u vms-monitor-agent -f
```
The agent logs in JSON (slog). On startup and config sync you should see lines like:
```json theme={null}
{"level":"INFO","msg":"starting vms-monitor-agent","version":"v0.9.8"}
{"level":"INFO","msg":"agent started","agentKey":"web-01/appuser","configVersion":12,"probes":2}
{"level":"INFO","msg":"agent config applied","version":13,"probes":3}
```
Probe results are buffered and shipped to the ingress asynchronously; only failures produce `WARN`/`ERROR` lines (e.g. `ingress send failed; will retry`).
## Steps to Configure a New Probe
You add or update monitoring probes through the VMS Dashboard; the configuration is synced down to the Agent.
Determine what host, service, or endpoint needs monitoring. For example, to check the HTTP endpoint of a web service at `https://api.verolabs.co/health`.
Choose the appropriate probe type based on your target:
* Use `host_resource` for monitoring CPU, RAM, or Disk.
* Use `http_check` for monitoring HTTP/HTTPS endpoints.
* Use `check_port` for checking TCP port reachability (e.g. SSH port 22, database ports).
Configure the probe with basic attributes like identifier `code`, display `name`, run `intervalSeconds`, and the specific probe `config` block.
Example configuration for an HTTP Check probe:
```json theme={null}
{
"code": "api-health-check",
"name": "HTTP check API Vero",
"type": "http_check",
"intervalSeconds": 60,
"timeoutMs": 5000,
"enabled": true,
"config": {
"url": "https://api.verolabs.co/health",
"method": "GET",
"expectedStatus": [200]
}
}
```
* On the VMS Dashboard, click **Save / Apply** to deploy the configuration to the Agent.
* The Agent automatically pulls the new configuration on its sync cycle (`VMS_CONFIG_REFRESH_SECONDS`, usually 30–60s) without a service restart.
## How to Verify if a Probe is Successful or Failing
### 1. Check Status on VMS Dashboard
* **Success State (Green):** The probe returns a valid response, and all assertions (if any) pass. The dashboard indicates this with a `Green` status dot.
* **Failed State (Red):** The probe fails to connect or assertion fails (e.g. HTTP status 500 instead of 200). The dashboard status changes to `Red` or `Critical`, and alerts are sent out to the configured channels.
### 2. Check logs on the Host
You can view the VMS Agent service logs to verify that configuration updates are received and probes are executing successfully:
```bash theme={null}
# View real-time logs of VMS Agent
journalctl --user -u vms-monitor-agent -f
```
The agent logs in JSON (slog). On startup and config sync you should see lines like:
```json theme={null}
{"level":"INFO","msg":"starting vms-monitor-agent","version":"v0.9.8"}
{"level":"INFO","msg":"agent started","agentKey":"web-01/appuser","configVersion":12,"probes":2}
{"level":"INFO","msg":"agent config applied","version":13,"probes":3}
```
Probe results are buffered and shipped to the ingress asynchronously; only failures produce `WARN`/`ERROR` lines (e.g. `ingress send failed; will retry`).