Probe Configuration Overview
Once you have successfully installed the VMS Agent Collector, you can start configuring Probes to monitor host resources, network ports, containers, logs, or service endpoints. The VMS Dashboard interface allows you to view the list of active agents, monitor their health status, and manage their corresponding probe configurations: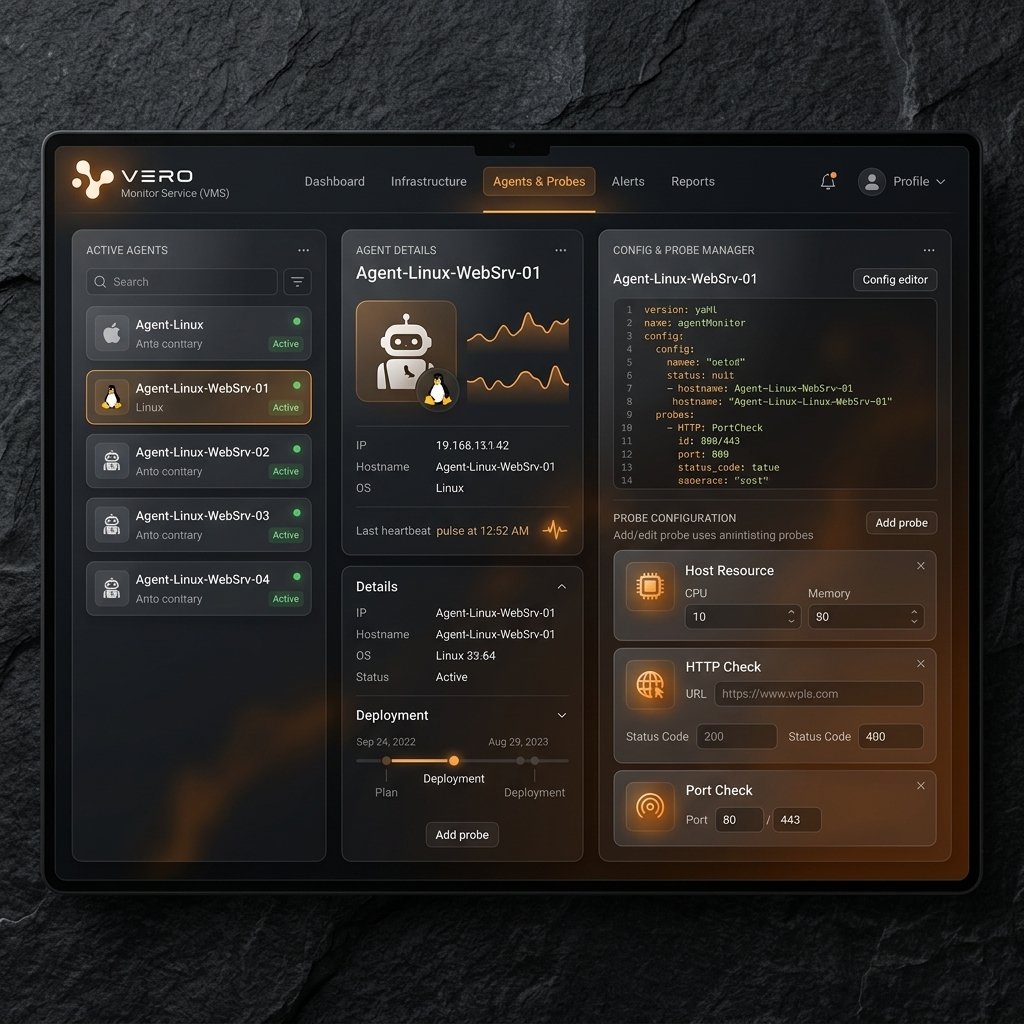
Steps to Configure a New Probe
You can add or update monitoring probes through the VMS Dashboard or by editing the Agent’s configuration file directly.Identify the Target
Determine what host, service, or endpoint needs monitoring. For example, to check the HTTP endpoint of a web service at
https://api.verolabs.co/health.Select the Probe Type
Choose the appropriate probe type based on your target:
- Use
host_resourcefor monitoring CPU, RAM, or Disk. - Use
http_checkfor monitoring HTTP/HTTPS endpoints. - Use
check_portfor checking TCP port reachability (e.g. SSH port 22, database ports).
Define the Configuration (JSON / YAML)
Configure the probe with basic attributes like identifier
code, display name, run intervalSeconds, and the specific probe config block.Example configuration for an HTTP Check probe:Apply and Reload Configuration
- If using the VMS Dashboard, click Save / Apply to deploy the configuration changes to the Agent.
- If editing files manually, save the configuration file.
- The Agent automatically pulls new configurations based on
VMS_CONFIG_REFRESH_SECONDS(usually every 30s to 60s) without needing a service restart.
How to Verify if a Probe is Successful or Failing
1. Check Status on VMS Dashboard
- Success State (Green): The probe returns a valid response, and all assertions (if any) pass. The dashboard indicates this with a
Greenstatus dot. - Failed State (Red): The probe fails to connect or assertion fails (e.g. HTTP status 500 instead of 200). The dashboard status changes to
RedorCritical, and alerts are sent out to the configured channels.