The VMS agent collector (Vero Metric Collector) is installed at the customer host or site to collect metrics, checks, and logs, then securely push them to the central VMS Master over HTTPS.
Cross-Platform Support: VMS Agent natively runs on Linux as a systemd service and on Windows as a Windows Service, as well as containerized options (Docker / Kubernetes).
Agent Deployment Overview
Below is the connection and reporting structure of the VMS Agent deployed on both Linux and Windows environments: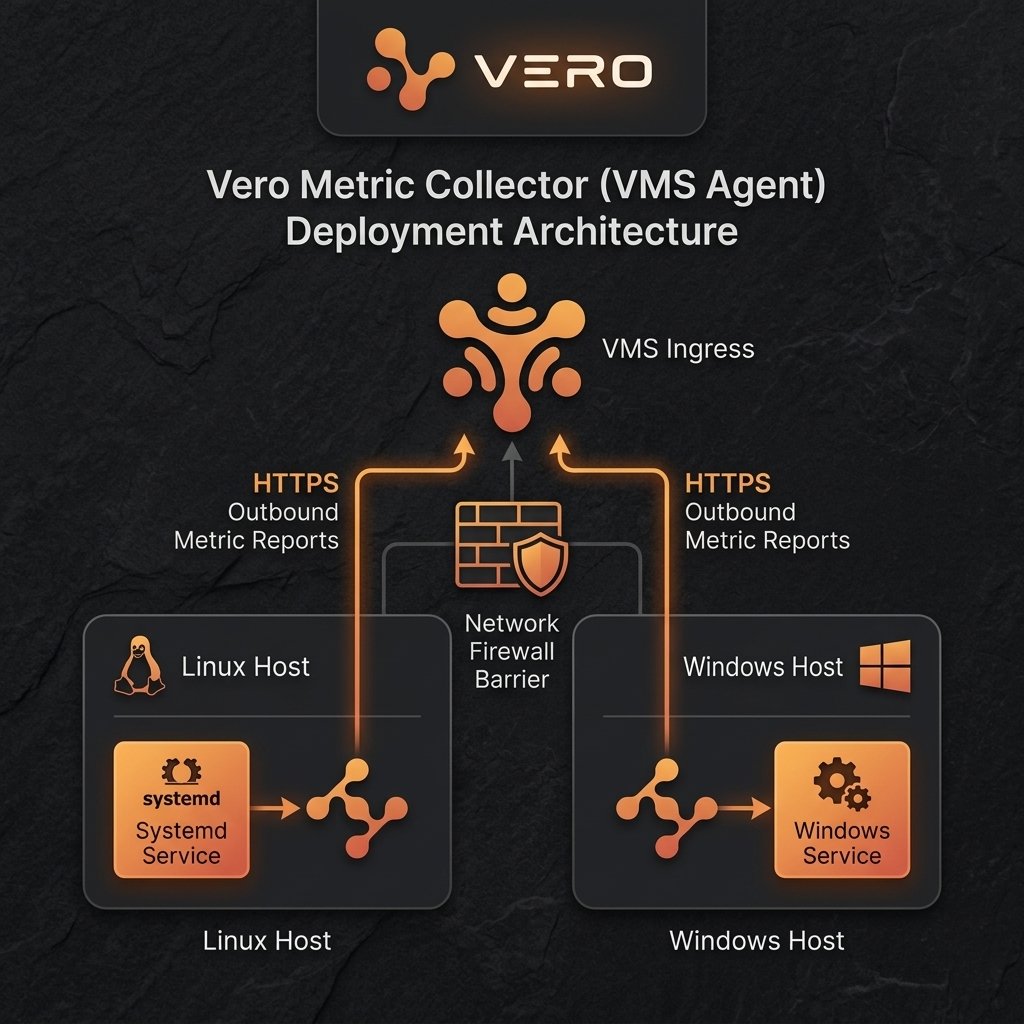
Prerequisites (Agent)
| Prerequisite | Description |
|---|---|
| OS | Linux (systemd) or Windows (Windows Service) |
| Connection | Outbound HTTPS connectivity to the VMS Master INGRESS_URL. No inbound ports are required |
| API Key | A valid agent auth key generated from VMS Master |
| TLS Mode | Trusted SSL Certificate or path to the custom CA file |
Deployment Flow on Linux (systemd)
These installation steps follow the Step (Action) - Check (Verification) - Result (Expected Outcome) structure:1. Download and Install Agent Binary
- Step: Download the installation script from your customer domain to pull down the binary:
- Check: Verify that the binary runs and displays version information:
- Result: Version, build date, and git commit of the agent are successfully printed.
2. Configure Environment and TLS certs
- Step: Configure
/etc/vms-monitor-agent/agent.envwith variables and specify the CA cert path if self-signed: - Check: Read the file to ensure variables are set:
- Result: The environment file is generated containing all required connection keys.
3. Launch systemd Service
- Step: Reload systemd configurations, enable and start the agent daemon:
- Check: Query the systemd service status:
- Result: The service status displays
active (running).
Deployment Flow on Windows (Windows Service)
Windows installation steps structured as Step (Action) - Check (Verification) - Result (Expected Outcome):1. Download Installer Script
- Step: Open an elevated PowerShell session (Admin) and download the install utility script:
- Check: Test that the script file was successfully saved:
- Result: Output evaluates to
True.
2. Execute Installation Script
- Step: Run the helper script specifying the ingest URL and your key:
- Check: Verify the installation target contains the executable:
- Result: Executable executes and prints version info.
3. Start Windows Service
- Step: Start the service via Service Controller:
- Check: Verify the service status:
- Result: The status returns
Running.
Generic Probe Configuration Structure
All monitoring configs are structured into a wrapper block containing metadata and a customconfig block.
| Field | Required | Meaning |
|---|---|---|
code | Yes | Unique probe identifier |
name | No | Display name on dashboards |
type | Yes | Probe type, for example host_resource, http_check |
intervalSeconds | No | Probe run interval |
timeoutMs | No | Per-run timeout |
retryCount | No | Retry count when a check fails |
enabled | No | Enable/disable this probe |
targetId | No | Related host/service ID |
labels | No | Extra labels such as system, env, owner |
config | Yes | Probe-specific config |
Supported Probes
See individual probe pages in the left menu for detailed config. Summary:| Probe type | Group | Description |
|---|---|---|
host_resource | Core | Collect CPU, memory, disk, disk IO, network |
check_port | Core | Check TCP port open/closed |
ping | Core | Check host reachability (ICMP / TCP fallback) |
http_check | Core | Check HTTP/HTTPS endpoint |
dns_check | Core | Check DNS record resolution |
tls_cert | Core | Monitor TLS certificate expiry |
process_mon | Core | Monitor running processes |
service_mon | Core | Check systemd / Windows service state |
connection | Core | Check connection count by filter |
connection_mon | Core | Monitor TCP connection between process and service (bidirectional) |
file_check | Core | Check file existence, size, age |
log_mon | Core | Count log lines matching pattern |
log_get | Core | Ship log lines with redaction |
auto_discovery | Core | Discover connection inventory and topology |
custom_check | Opt-in (vms_custom_check) | Run approved executable |
container_mon | Heavy (vms_heavy) | Monitor Docker / Swarm containers |
k8s_mon | Heavy (vms_heavy) | Monitor Kubernetes workloads/pods/nodes |
snmp_check | Heavy (vms_heavy) | Poll SNMP OIDs |
wmi_perf | Heavy (vms_heavy) | WMI queries on Windows |
Troubleshooting
| Symptoms | Likely Cause | Resolution |
|---|---|---|
| Agent fails to start immediately | Missing ingest URL or API key | Check environment variables or configuration file |
401 Authentication blocked | Invalid or rotated API key | Fetch a new key from VMS Master and restart agent |
x509 unknown authority | Ingress using self-signed cert | Set VMS_TLS_CA_FILE environment variable to CA certificate |
| Ping transitions to TCP fallback | Lack of ICMP socket privileges | Assign CAP_NET_RAW or allow fallback |
| Connection/Process logs missing names | Lack of system process reading access | Execute as privileged user or grant CAP_SYS_PTRACE |